Job Board
Activity of the scheduler and the workers, right now and over time. Live jobs, the reason behind each worker choice, fleet load and the most expensive builds all appear on the board. Job Board in the header.
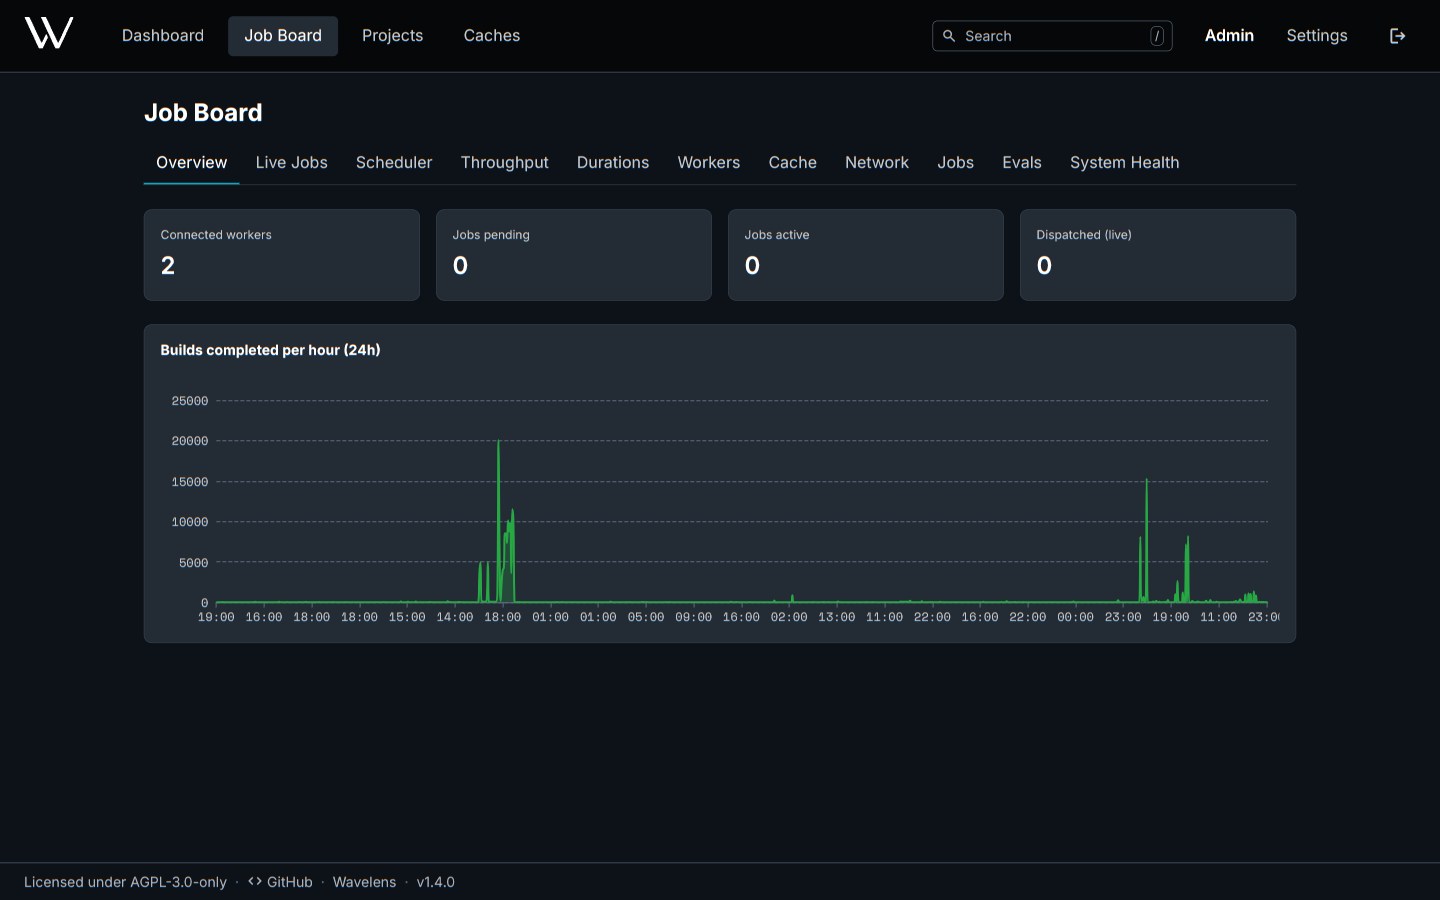
| Tab | Content | Actions |
|---|---|---|
| Overview | Connected workers, pending and active jobs, builds per hour | |
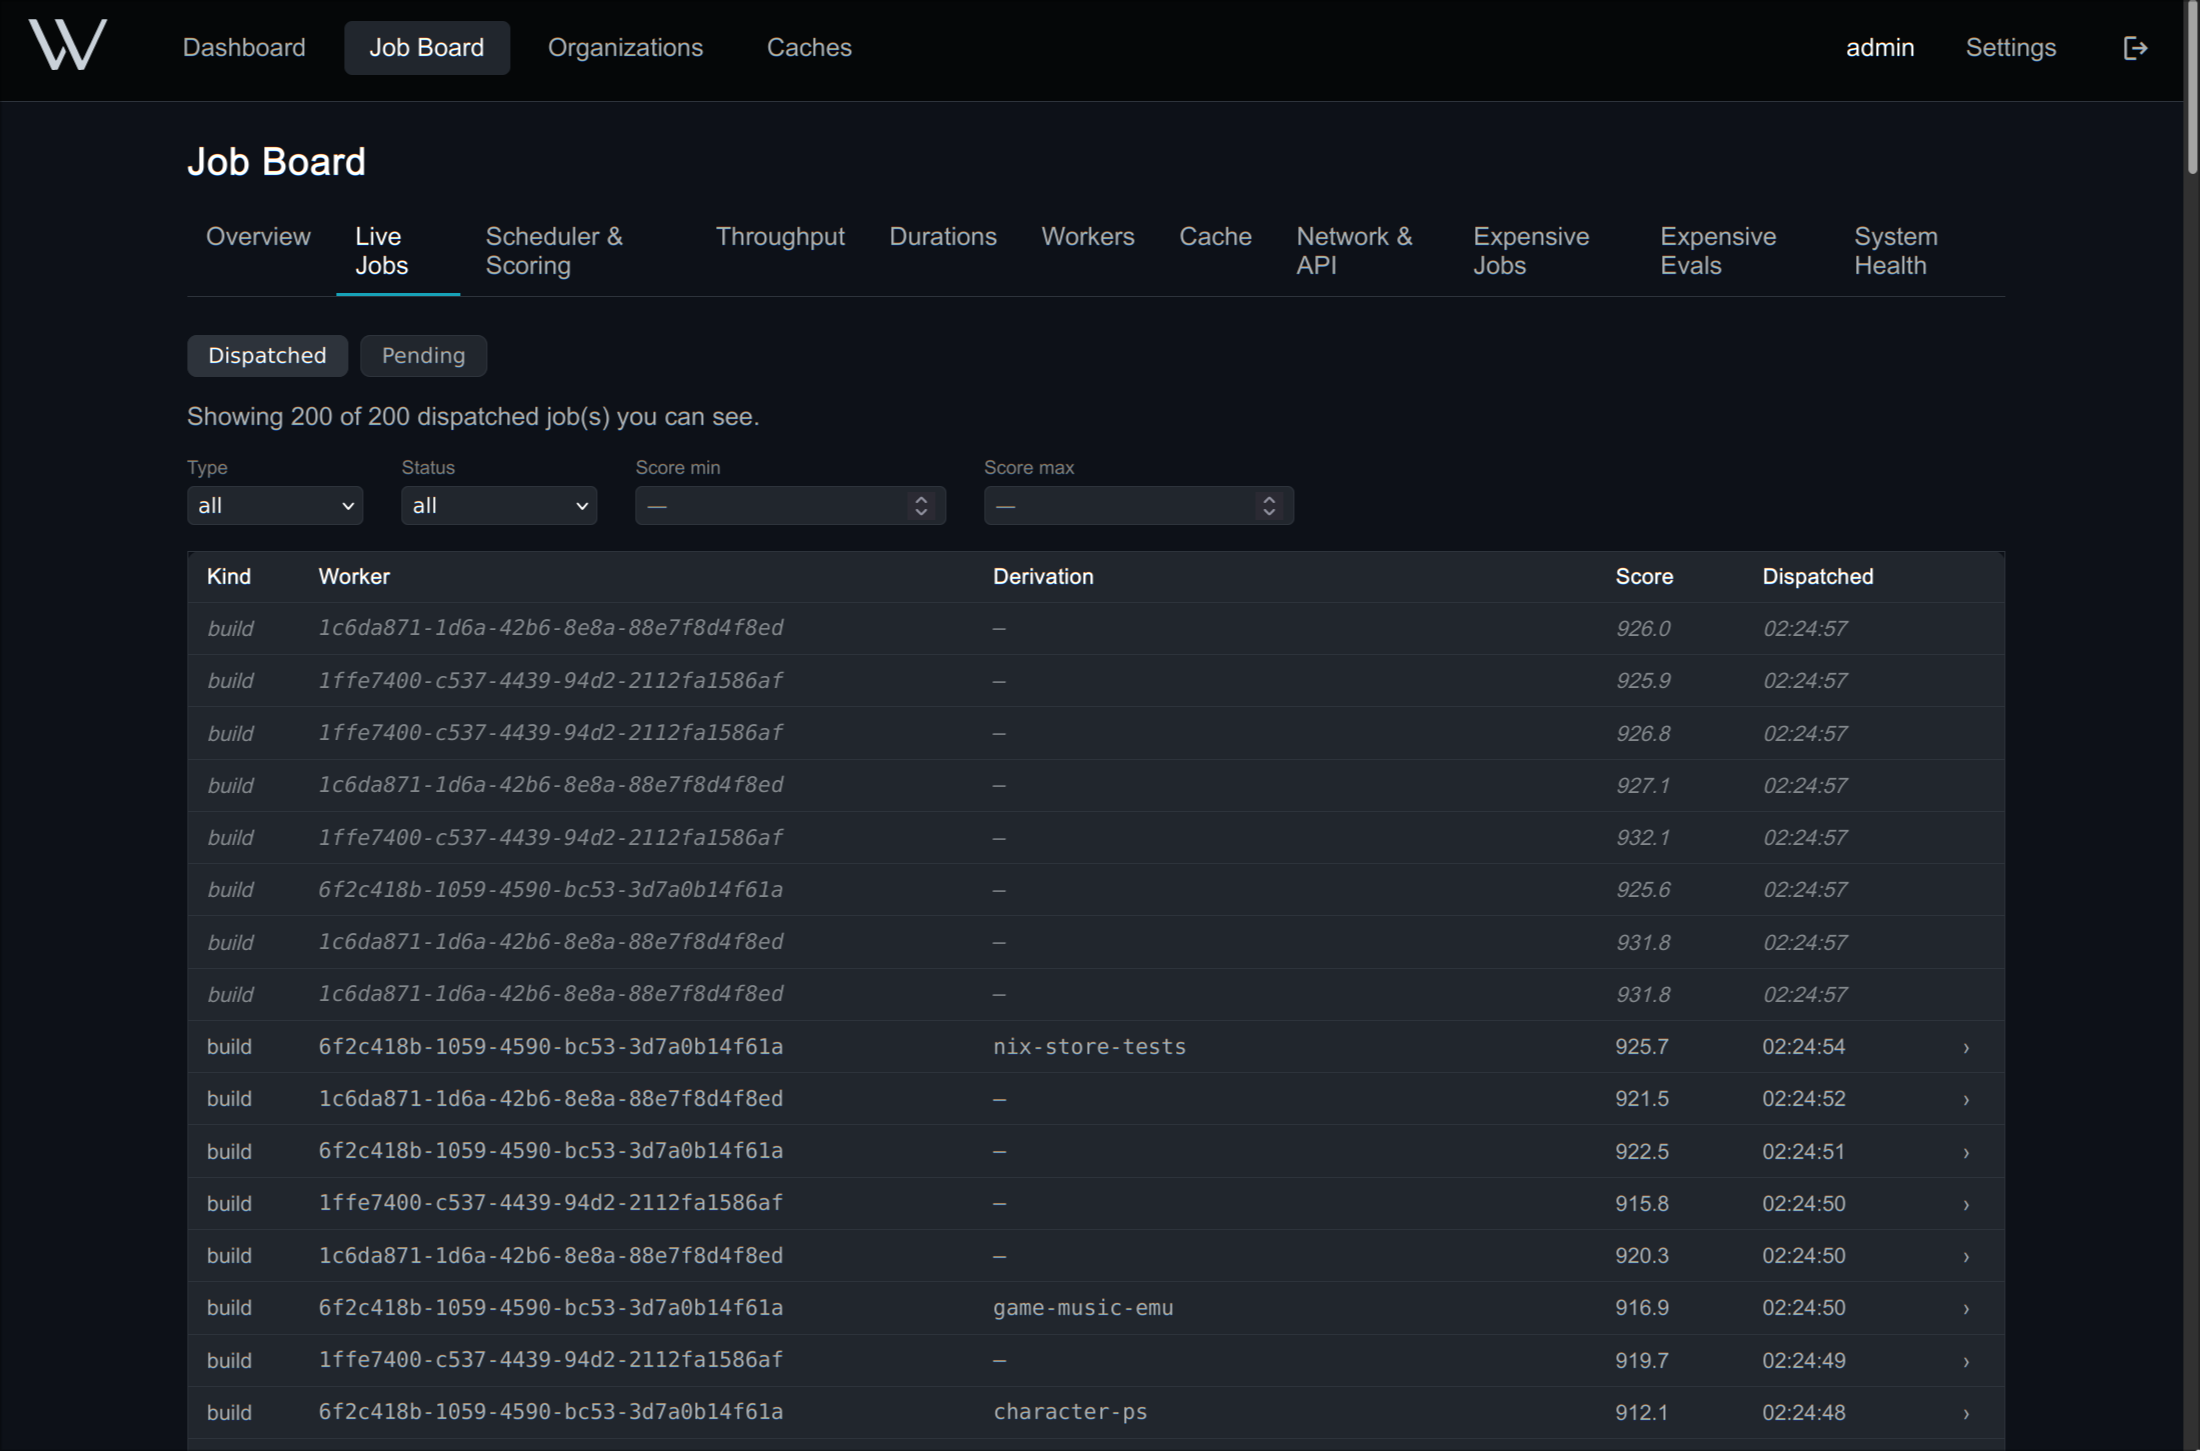
| Live Jobs | Jobs running now, updated live | Open a job's inspection page |
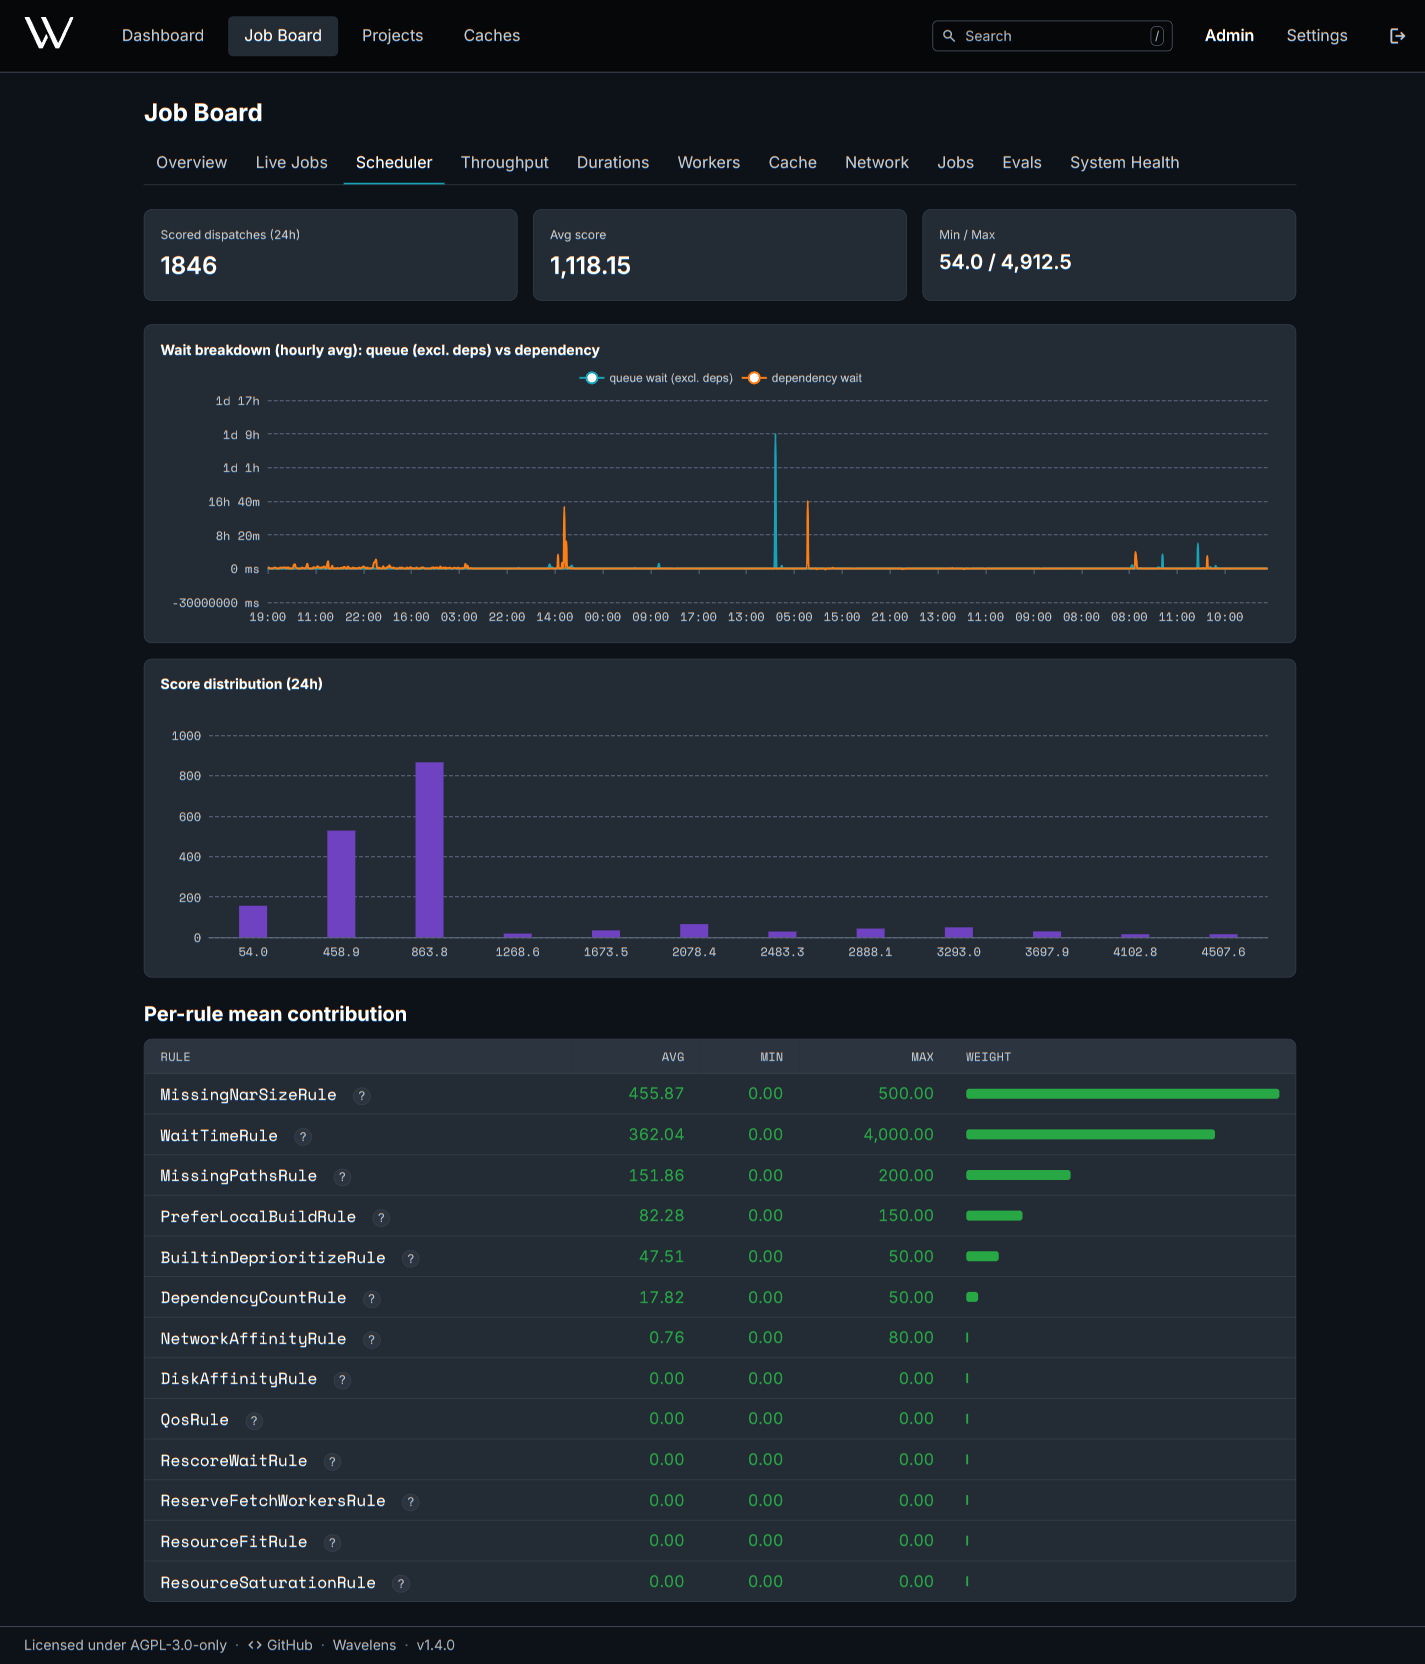
| Scheduler | Queue wait against dependency wait, score distribution, mean contribution per scoring rule | ? next to a rule for an explanation of the rule |
| Throughput | Builds created, completed and failed, evaluations per hour, active jobs per worker | |
| Durations | Average and maximum build time, the wait split over time | |
| Workers | Fleet size, load by capability, system and feature, slot use per worker | Spot the missing kind of worker |
| Cache | Stored size, traffic, growth, latency per upstream cache | |
| Storage | NAR storage latency and errors per operation (file or S3), writer lane fill and send stalls, NAR delivery queue and failures. Every chart on one time axis over the whole window, minute resolution up to 6 h. Superusers only | Pick the time window |
| Network | NAR egress, worker upload, download and disk speed, HTTP latency per route | |
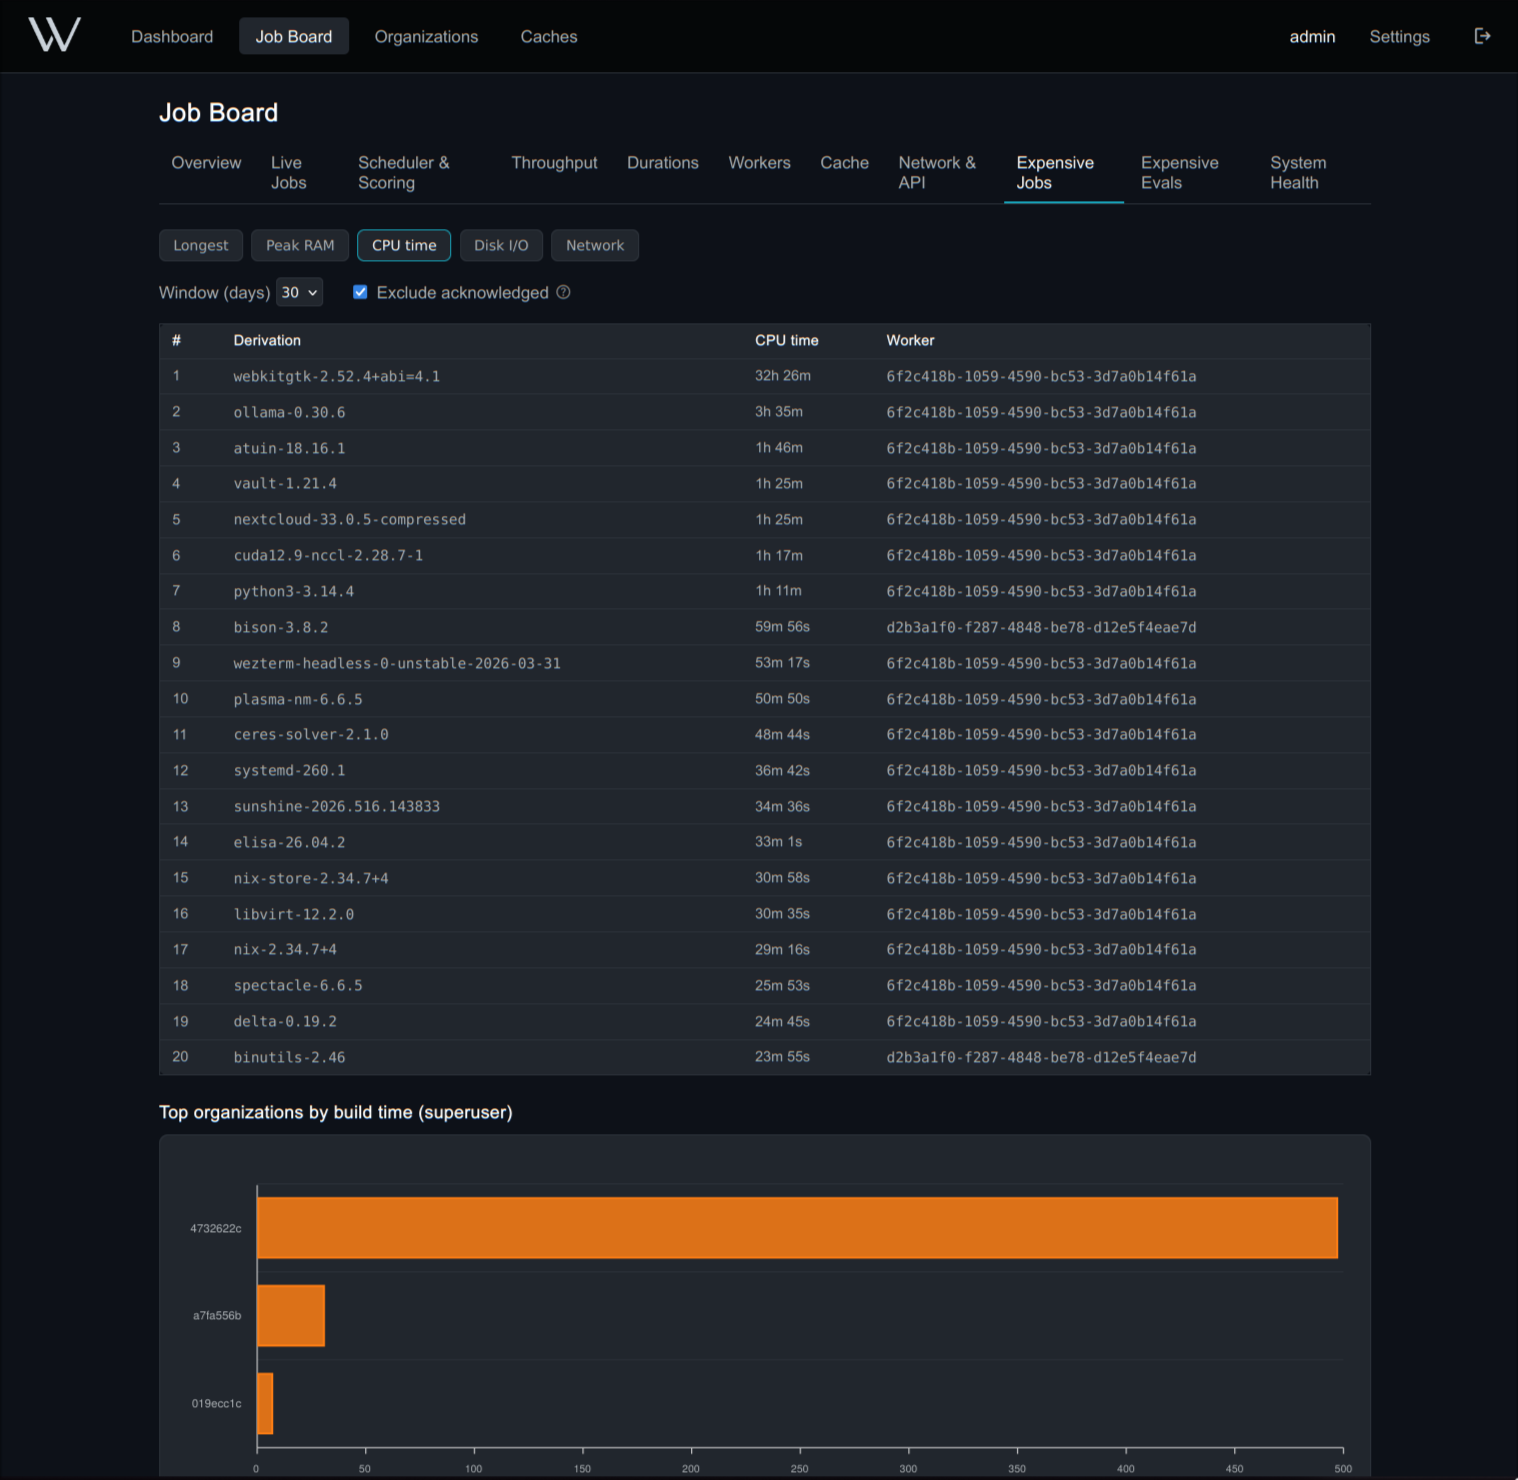
| Jobs | The costliest builds by wall time, peak RAM, CPU time and disk I/O | Pick the time window |
| Evals | The costliest evaluations by time, peak memory, thunks, function calls and allocations | Pick the time window |
| System Health | Server runtime, metric pipeline lag, route stats. Superusers only | Run Deep GC. Enable Draining |
Draining will stop new job handouts and park running evaluations. The next start will clear the flag. A server stop is safe without draining, and the next start will queue interrupted work again.
Storage Metrics
The Storage tab will read these metric keys. Counts add up per bucket. Empty buckets count as zero events.
| Key | Labels | Unit | Chart |
|---|---|---|---|
storage.op_ms |
Operation: get, head, put, put_part, multipart_create, multipart_complete, delete |
ms per call | Storage latency |
storage.op_errors |
<op>/error, <op>/cancelled, read/error |
count | Storage errors |
proto.bulk_lane_fill |
bulk |
peak fill 0-1, shown as % | Writer lanes |
proto.control_lane_fill |
control |
peak fill 0-1, shown as % | Writer lanes |
proto.send_stalls |
bulk, control |
count | Writer lanes (bars) |
nar.serves_waiting |
waiting |
peak serves | NAR serves |
nar.serves_active |
active |
peak serves | NAR serves |
nar.serve_failures |
not_found, storage_timeout, storage_error, send_stalled |
count | NAR serves (bars) |
- A
cancelledcall is a dropped call, usually cut off by a timeout on a hung backend. - Lane fill and send stalls cover every protocol session, worker and cache alike. A stall is a send waiting past
send_chunk_timeoutfor lane capacity. - Build log objects on S3 go through the same store and share the storage operation labels.
Job Inspection
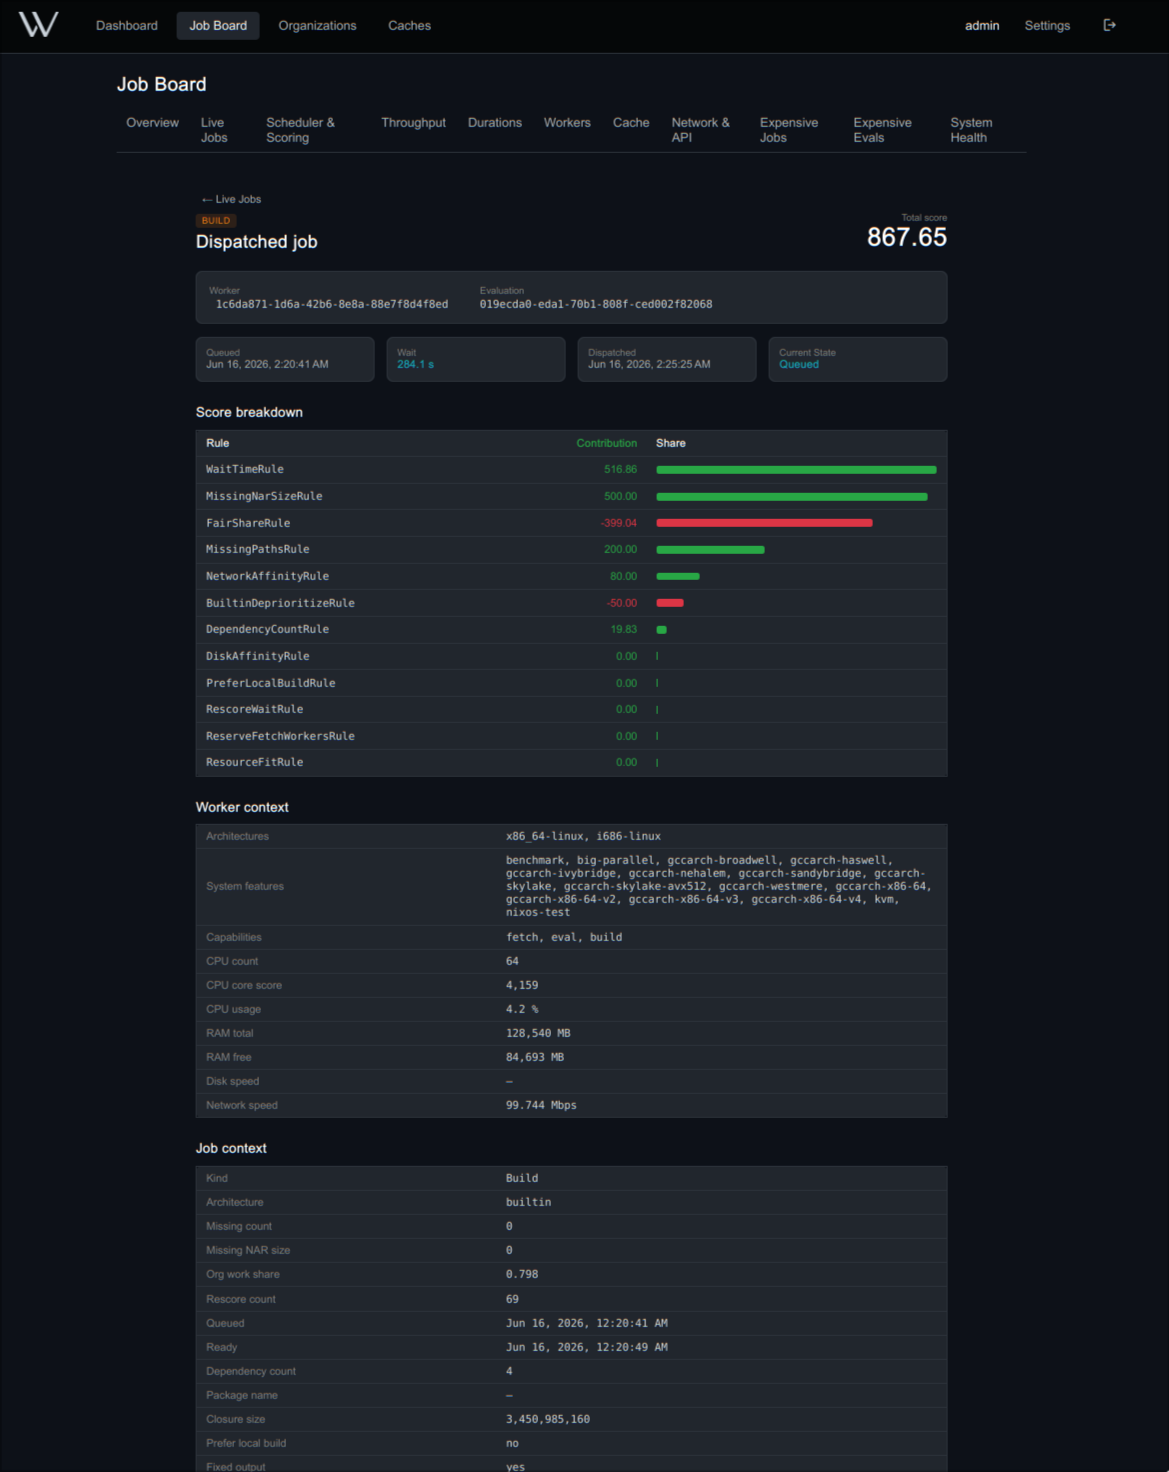
Jobs opened from Live Jobs show five parts.
- The server's marks: Queued, Ready, Assigned, Finished.
- Worker tail: the worker's time after its last phase, for finished jobs.
- Transit: the rest of the time between Assigned and Finished of a finished job, spent on the network and in queues on both ends.
- The worker timeline: nested phases (fetch, evaluate, build, compress, upload wait, NAR push) with duration, share and bytes moved.
- The score breakdown: each scoring rule's contribution to the winning worker.
The timeline shows where a slow job spent its time. The score will explain the worker choice for the job.
Timeline Phases
| Phase | Meaning |
|---|---|
fetch |
Cloning the flake source and fetching its missing flake inputs |
push_inputs |
Uploading the flake source and its inputs to the cache |
eval_flake |
Evaluating the flake outputs |
eval_derivations |
Resolving the outputs to derivations |
eval_cache_pull, eval_cache_push |
Waiting for and returning the shared evaluation cache |
known_derivations_wait |
Waiting for the server to name the .drv files already known to the server |
drv_closure_push |
Pushing a batch of .drv closures |
prefetch |
Bringing a build's inputs from the cache into the local store |
nar_fetch |
One round of input downloads, nested under prefetch |
nar_import |
Importing the downloaded inputs into the local store, nested under prefetch |
substitute_fetch |
Fetching one output from an upstream cache |
download |
One builtin:fetchurl, fetched by the worker without Nix |
build |
One derivation build |
compress |
Packing the job's outputs for upload |
nar_push |
Uploading a batch of NARs, nested under compress for outputs |
cache_query_wait |
Waiting for a cache status reply |
Jobs record at most 2000 phases. Further phases still run without individual timing.
Workers
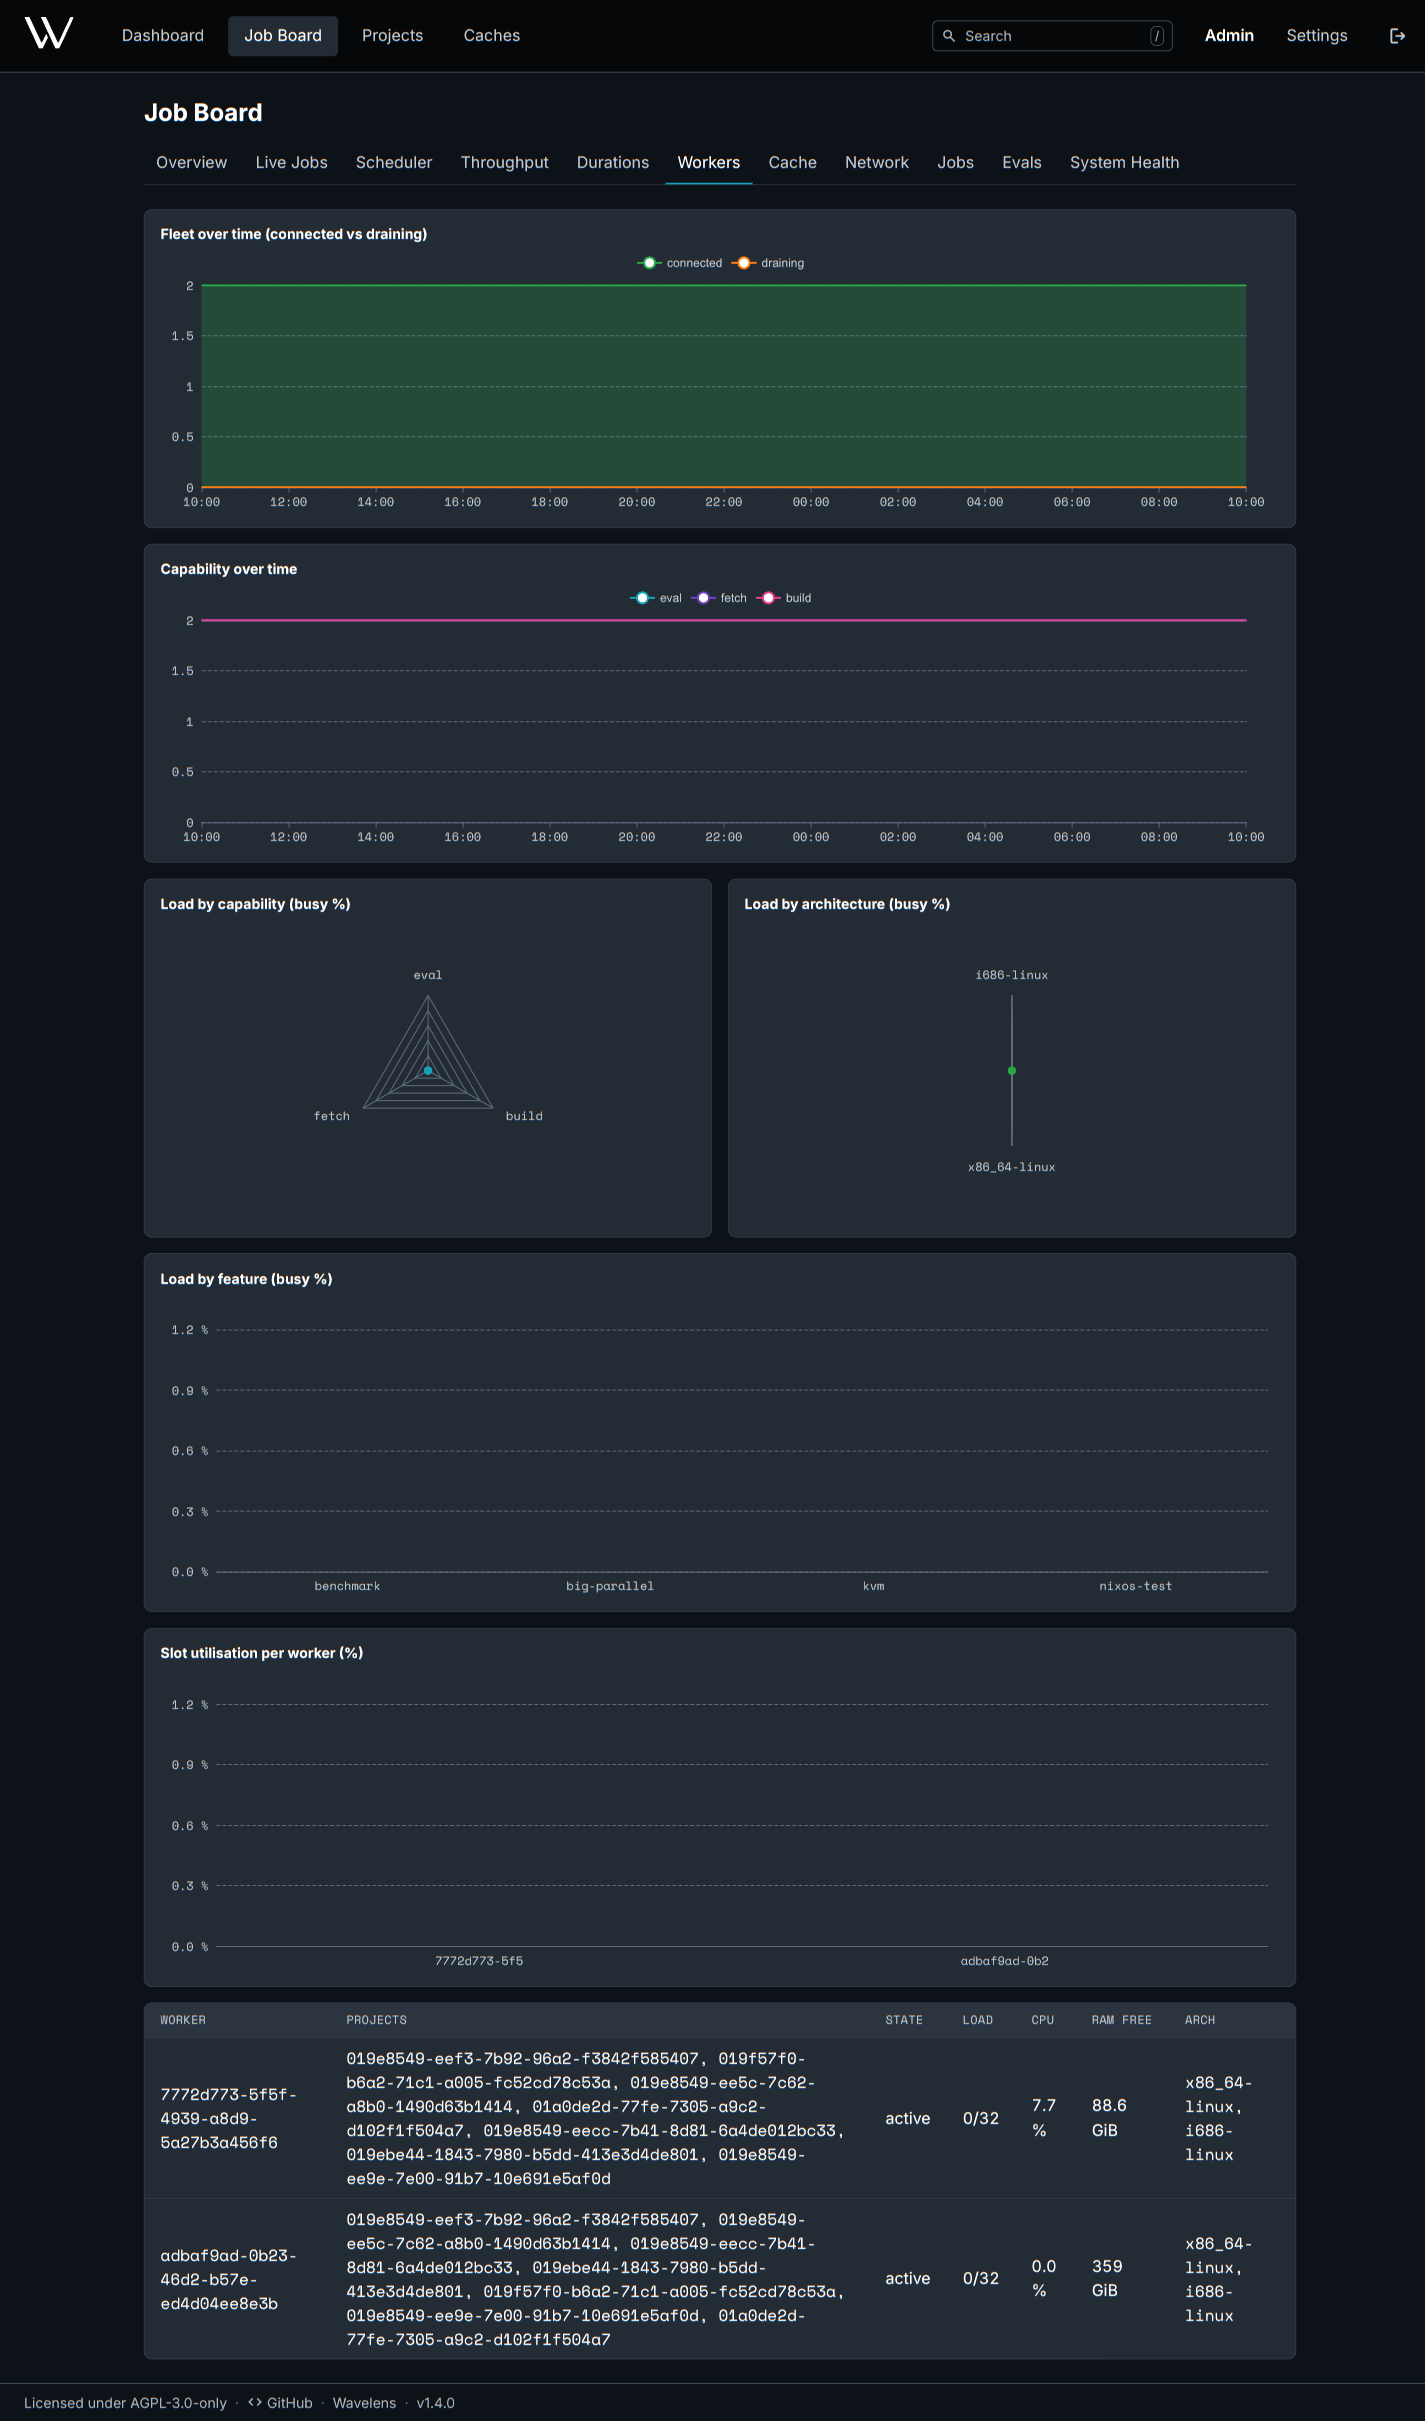
Load charts set the running jobs of one kind against the slots of the workers taking that kind. A chart near 100% will name the worker type to add: evaluation, build, a system such as aarch64-linux, or a feature such as kvm.
Project -> Workers -> Metrics has the per-worker CPU, memory, disk, upload and download history. The connection and disconnect history will stay there for retentionDays (90 days by default).
Visibility
| Viewer | Visible Scope |
|---|---|
| Superuser | Everything |
| Member | Own and public projects in full. Other projects' infrastructure only as counts |
| Signed out | Public project totals |
The resource tabs need build metrics on the workers, configured with services.gradient.worker.build.metrics. The retention settings live under metrics pipeline and retention.
Related
- Workers: capabilities and build matching
- Scheduler Policies: the scoring rules